Spatial Economics
- Welcome
- Our People
- Expertise
- Projects
Free Stuff - Contacts
Interactive Charts - Housing Charts
These charts are derived from the Housing Development Dataset for 2004-2011. The charts shown are for Total Dwellings 2004-2011, Vacant Lots 2004-2011 and Constructions 2004-2011. A drop down menu allows for the selection of any of the 31 LGAs within metropolitan Melbourne.
A full summary of HDD for 2004 - 2011 can be downloaded here: HDD_LGA_Summary_2004-2011.xls

Metro Maps - Housing Density
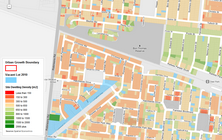
The Metropolitan Housing Density Map shows the dwelling density for each dwelling across Melbourne on a site by site basis. The data is at the end of 2011 whereas the date of capture for Google maps photography can vary across Melbourne. Vacant lots are also shown. It is possible to zoom to varying levels. Only dwellings inside the Urban Growth Boundary are captured in the map.

Metro Maps - Housing Construction
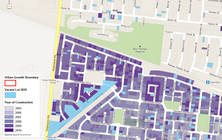
The Metropolitan Housing Construction Map shows residential construction activity on a lot by lot basis for the years 2004-2011. This data is derived from Housing Development Data and is projected onto Google maps.
