Spatial Economics
- Welcome
- Our People
- Expertise
Projects - Free Stuff
- Contacts
Housing Development Data
Indroduction
Housing Development Data (HDD) is a spatial dataset containing a highly accurate count of existing dwellings, vacant residential lots and residential developments. The data is collected annually on a lot by lot basis through an analysis of various spatial datasets including aerial photography, property boundaries, business registers, planning permit information and other key databases.
The data has been prepared for all individual lots across Melbourne where there is an existing dwelling or where the lot is located in a land use planning zone that provides for residential uses.
More information about the HDD dataset DPCD - Housing Development Data
Data collection
The principal data sets employed in this analysis are aerial photography and the cadastre. Aerial photography for metropolitan Melbourne is commissioned by the Victorian Government on a yearly basis and has been used in this analysis. The aerial photography was generally taken around late December of each year.
Customised GIS software has been developed to visually recognise built structures and therefore has the additional ability to recognise vacant allotments. The software has the ability to recognise via colour intensity and colour distribution associated with built structures and straight lines created by roof- lines. This combined with titling information allows the recognition of both built structures on a parcel by parcel basis, as well as the incidence of vacant lots.
| < | > | Source orthorectified aerial imagery |
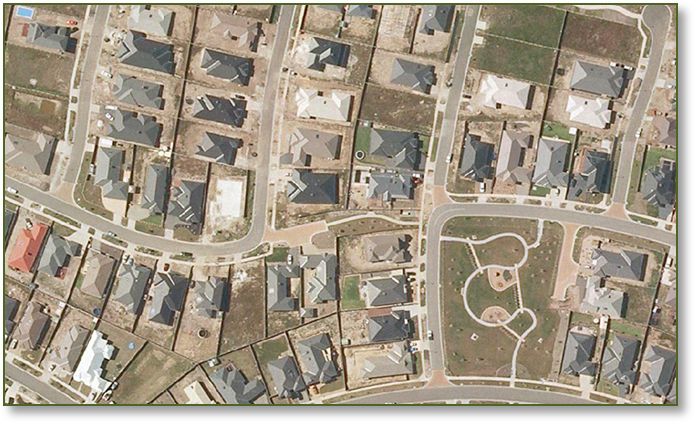
| Step 1. | Source orthorectified aerial imagery, (35cm/pixel) |
| Step 2. | Aerial imagery with detected edges |
| Step 3. | Combining imagery with vector cadastral layer |
| Step 4. | Processing built structures analysis |
| Step 5. | Final HDD Stock layer with labelled information about total dwellings |
Data assessment
Collected data for individual years is stored in stock layers. However comparing these stock layers for changes between consecutive years results in additional information about constructions and demolitions.
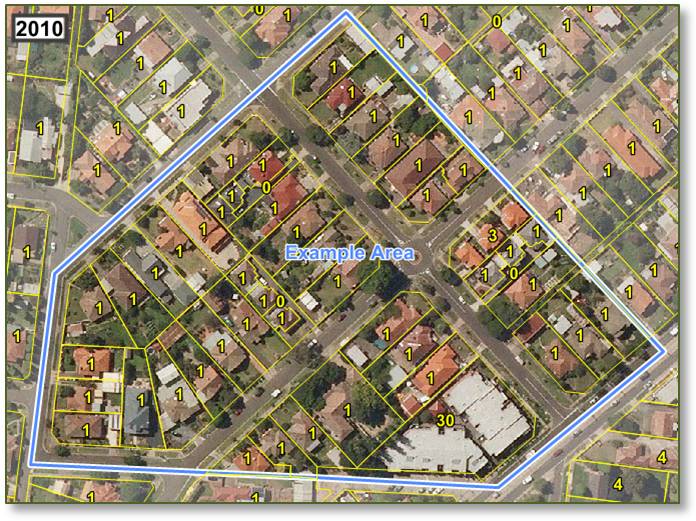
To illustrate how changes are calculated in project layers, an example polygon located in Reservoir is shown. An interactive map demonstrates the residential development activity within the 'Example Area' polygon. The stock of dwellings as well as constructions and demolitions are shown in the table.
To see the location of 'Example Area' in Google maps click here : Example Area in Housing Construction Map.
|
Stock Layer |
< | > | Construction of 1 dwelling |
| Year | Dwellings | Projects | Constructions | Demolitions | Change detected |
| 2004 | 44 | 0 | 0 | 0 | No change |
| 2005 | 46 | 2 | 4 | 2 | Construction of 4 dwellings and 2 demolitons |
| 2006 | 76 | 1 | 30 | 0 | Construction of 30 mulitlevel apartments |
| 2007 | 75 | 0 | 0 | 1 | Demolition of 1 existing dwelling |
| 2008 | 76 | 1 | 1 | 0 | Construction of 1 dwelling |
| 2009 | 78 | 1 | 2 | 1 | Construction of 2 dwellings |
| 2010 | 78 | 0 | 0 | 0 | No change |
| Total | n/a | 5 | 37 | 3 |
In summary the example above showed that between 2004-2010 there were 5 construction projects with a total of 37 dwellings constructed and 3 dwellings demolished, resulting in a net increase 34 dwellings.
The pictures and data are taken from 'HDD Extractor' which has been designed to automatically generate these types of statistics for any geographic area.
A full set of statistics generated for the 'Example Area' by HDD Extractor can be downloaded. It has more additional statistics about the stock of dwellings, vacant lots and development activity on an annual basis. Click here to download : HDD_04-10_for_Example_Area.xls
There are 4 types of projects that are illustrated in this example:
Types of Dwellings
All private dwellings are counted within the assessment and preparation of the HDD regardless of zone and dwelling type. However, not all 'potential' dwelling structures that could accommodate permanent residents or households are counted. Structures that have been excluded from the HDD include: